Main page
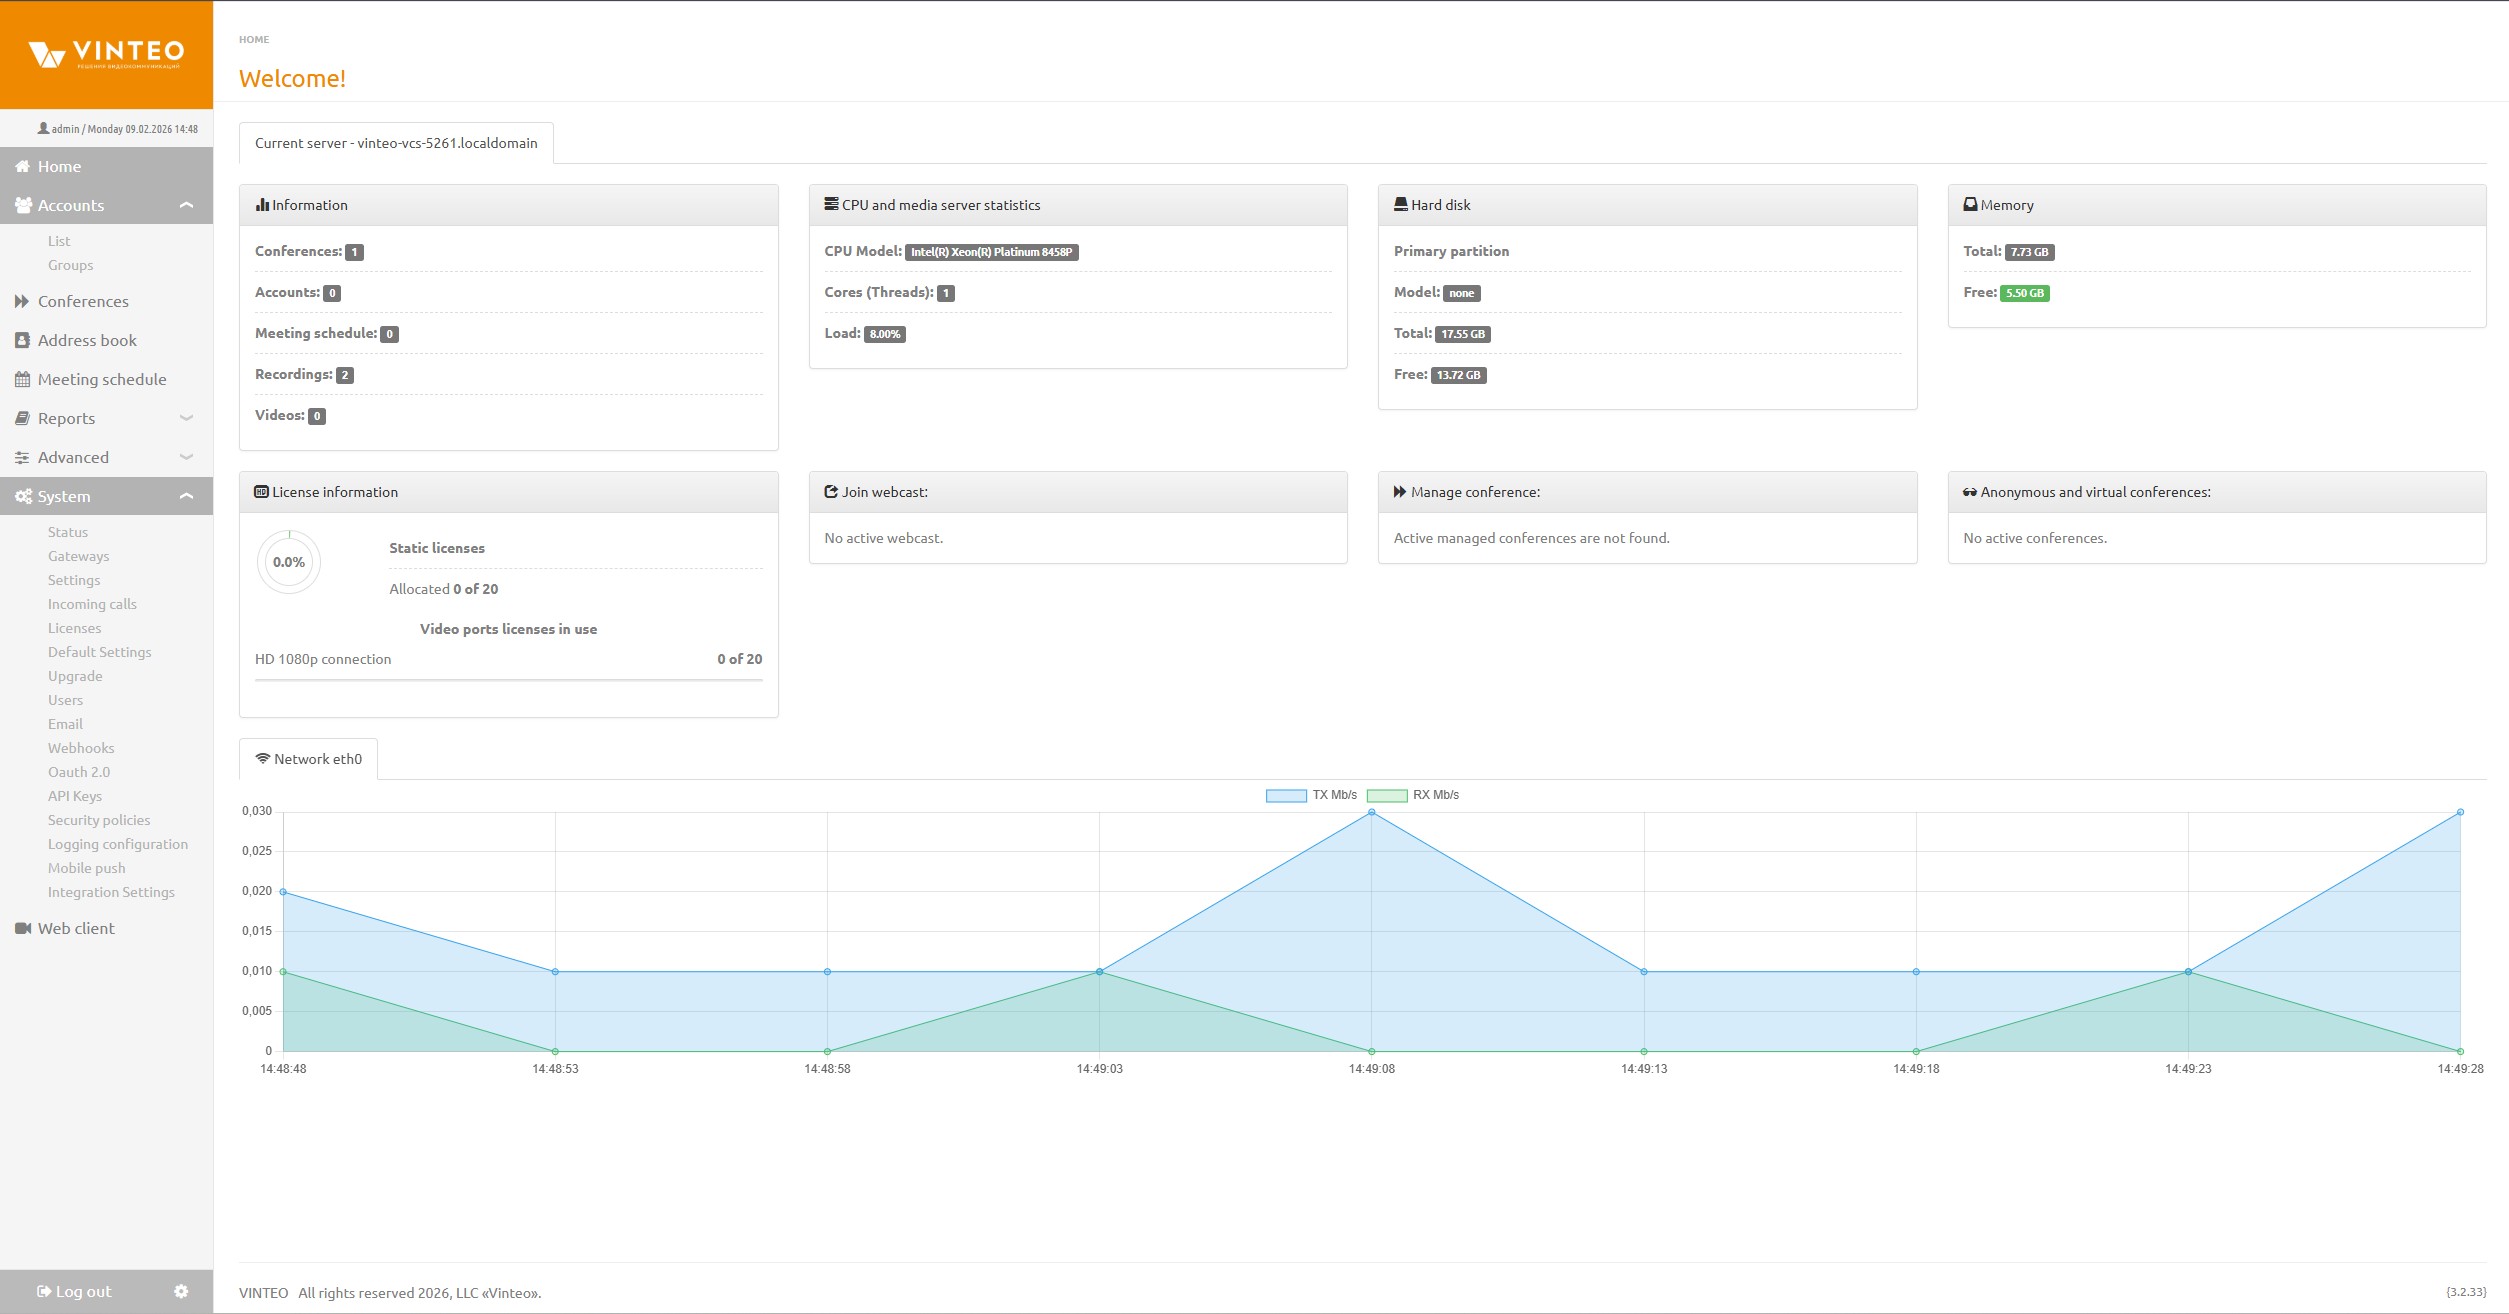
System configuration. Main configuration window
This window displays current information about the server and its modules, and also provides access to the configuration menu, current user settings and logout.
Information blocks
In this part of the main configuration window, information is displayed about the state of the server and its modules. Here you can also see widgets and host information.
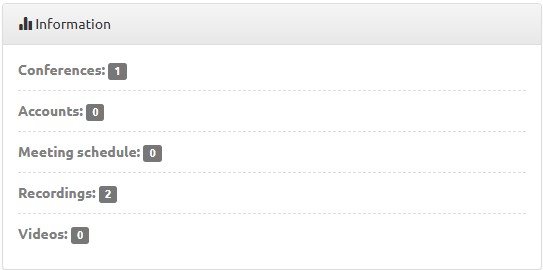
“Details” block
Displays information about the number of conferences, accounts, scheduled conferences, conference recordings, uploaded video clips, and information about the remaining license period or the absence of such a limit.
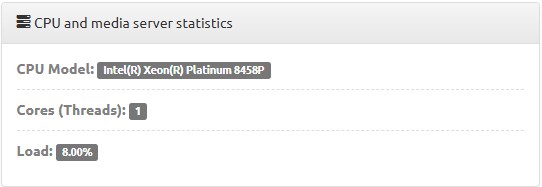
“CPU and media servers statistics” block
Displays information about the installed CPU model, number of cores, CPU load and media servers load.
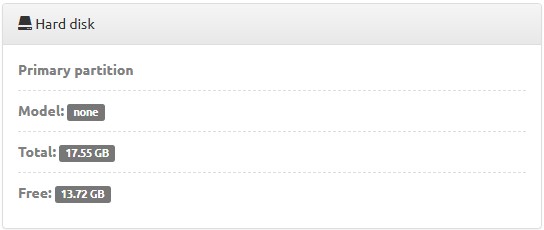
“Hard disk” block
Displays information about the hard disk model, its capacity and the available space for data storage.
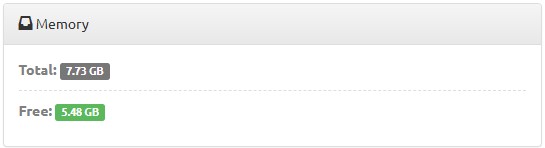
“RAM” block
Displays information about the total memory and the available free memory. The free memory value is shown with a green indicator. If the available memory falls below 20%, the indicator changes its color to red.
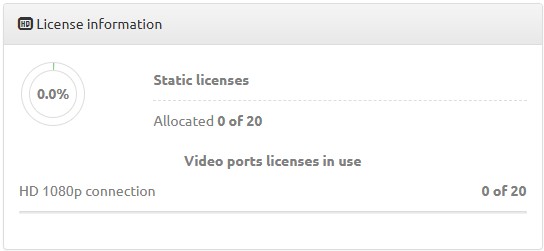
“License information” block
Displays information about installed licenses.
“Connect to web streaming” widget
Displays a list of links for joining a conference via a web browser. The number of connected participants is shown on the right of each link.
“Conference control” widget
Displays a list of active conferences for quick access to their configuration.
Information about conferences and streams is updated and sorted according to the number of connected participants: conferences or streams with more participants online are shown first. Green indicators show the number of online participants for each conference in the list. At the top of the list, information is displayed about the total number of online participants across all conferences, also with an indicator.
“Anonymous and virtual conferences” widget
Displays a list of active anonymous conferences as well as current P2P connections.
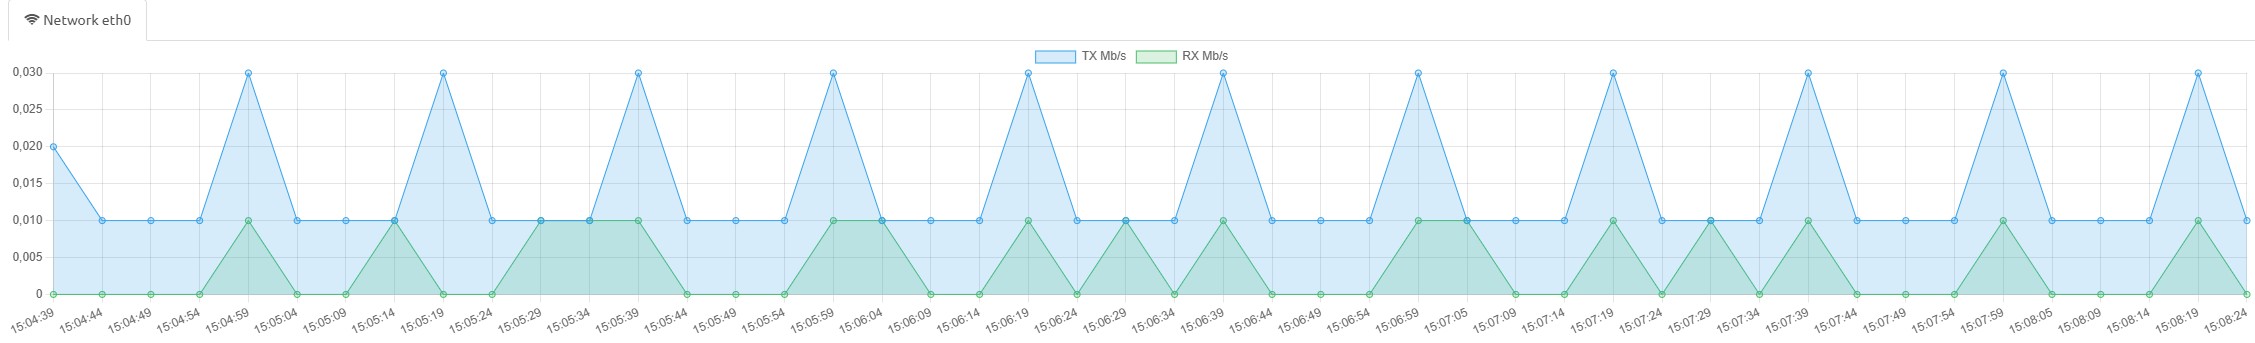
“Network connections” block
Displays real‑time load graphs for network interfaces.
When you click the TX or RX buttons, the corresponding network load graph is hidden or shown.
The graph is cleared by double‑clicking on the chart area.
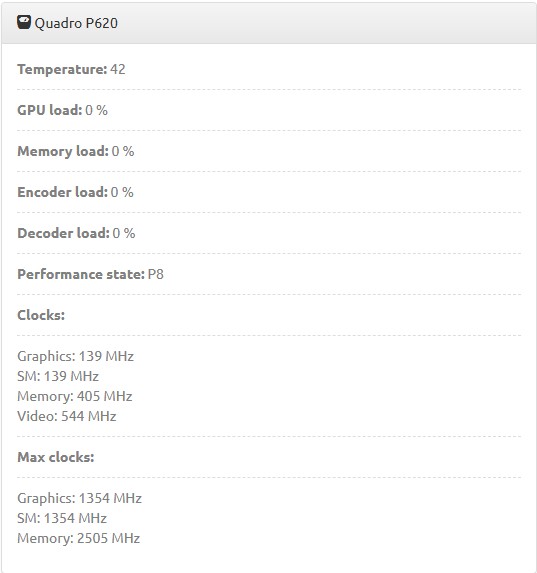
GPU block
Displays the presence of discrete GPUs with the following information:
* core temperature;
* core load;
* video memory load;
* encoder load;
* decoder load;
* performance mode;
* minimum clock frequencies in MHz;
* maximum clock frequencies in MHz.
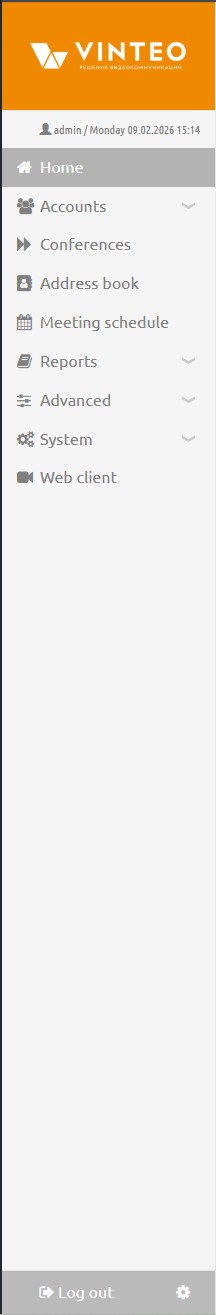
Configuration menu
This part contains the following elements:
* the Vinteo icon‑button collapses the menu into a narrow bar;
* an icon‑link to the main page;
* the “Accounts” drop‑down menu provides access to the “List” and “Groups” pages;
* the “Conferences” section provides access to the “Conferences” page;
* the “Address book” section provides access to the page with accounts and groups “mirrored” from the “List” subsection (Accounts section);
* the “Schedule” section provides access to the “Schedule” page;
* the “Reports” drop‑down menu provides access to the following pages: “Recordings”, “Call log”, “Conference logs”, “Security logs”, “Developer logs”;
* the “Additional” drop‑down menu provides access to the following pages: “Constructor”, “Video clips”, “Audio tags”;
* the “System” drop‑down menu provides access to the pages “Status”, “Gateways”, “Settings”, “Incoming calls”, “Licenses”, “Default settings”, “Update”, “Users”, “Email”, “Webhooks”, “OAuth 2.0”, “API keys”, “Security policies”, “Log settings”, “Mobile push notifications”, “Integration settings”;
* the “Web client” link allows the administrator to launch the web client from the current session;
* the “Logout” button logs the current user out of the system.